
One neatly wrapped up SaaS solution, which lives in the same Power BI workspace experience that we know and love, now called Fabric workspaces.
Since the moment ChatGPT exploded into the public lexicon late in 2022, you would be forgiven for thinking that the rate at which technology is developing seems to have increased exponentially.
You can’t attend a conference, or read a magazine, without having ‘AI’ shoved down your throat. What is your plan for it? How are you going to transform your business around AI? How are you going to prevent your impending doom?
And then, you can’t have missed that Microsoft announced ‘Fabric’ in May 2023. In their own words, “Microsoft Fabric is an end-to-end analytics solution with full-service capabilities, including data movement, data lakes, data engineering, data integration, data science, real-time analytics, and business intelligence – all backed by a shared platform providing robust data security, governance, and compliance.”
But what does that mean, I hear you cry? What do I need to know? How do I make use of it in a way that will actually have an impact on my business today and tomorrow? How much does it cost?
To tell you about Fabric, we need to talk about analytics, and to talk about that, we need to talk about reporting. Which takes us back to the beginning.
In the beginning there was Excel
Excel feels like it has been around forever. Infinitely flexible, and extremely powerful. We can use Excel to analyse data, to summarise it, to format and present it. VLOOKUPS, SUMIFS, SUMPRODUCTS, VBA macros. In the right hands, anything is possible. In the wrong hands (or the well-meaning but uninformed hands), it’s dangerous.
All that flexibility means that any user can edit any formula in any cell. Reports that started life as single-tab spreadsheets grow and morph into 30-tab behemoths. Spaghetti functions, chains of interdependent formulas and calculations which underpin the monthly management reporting, the weekly sales and intake reports, and the daily dispatches, picks and putaway reports.
All these reports are controlled by siloed teams, and by varying individuals. Management packs which take seven days to create, manually pinning together exported data. Inconsistencies between versions, reconciliation differences. Files which corrupt or bring individual laptops to a smoking halt. An initial handful of spreadsheets used to assess useful detail has morphed into dozens if not hundreds of them, with many businesses using Excel as the filler to work around systems and glue everything together.
These files underpin the decision-making of many businesses, which depend on them. Every business manager craves the ability to automate these processes, to govern the logic built into them, to prevent siloes and differing versions of the truth, and to evolve from this traditional reporting to trustworthy, automated truly actionable analytics. Sound familiar?
Let there be light - Power BI
The advent of Power BI was the answer to our prayers. Suddenly, we had the ability to extract data from one or multiple data sources on an automatically refreshing basis, to combine data from these sources into a single data model, and to create visual, interactive dashboards for users to consume via desktop or mobile, securely through a web browser wherever we were in the world.
The product initially competed with products like Tableau and QlikView, and Power BI’s feature-set was not as advanced. Microsoft relentlessly released new features every month, to the point that it has left its competition behind. Everything from handling ETL through a clear audit trail of transformations in Power Query, to an automated machine learning wizard which allows you to build and deploy your own machine learning models for predictive analytics presented directly in Power BI. With Gartner declaring Microsoft a leader in analytics platform offerings for seventeen consecutive years (June 2024), and the “leading leader” for the sixth consecutive year, where else do you need to go?
Power BI provides no delay in the request for analysis because the report and dataset is already there for us to interact with, to self-serve answers to our questions. The build, validation and automation are all done once, allowing us to trust the reporting thereafter.
This utopia gave birth to its own problems. This report refreshes eight times per day? Well, I need it in real-time (do you really, though?). This means we use a direct query connection which refreshes from the database with every interaction. Why does my report run so slowly now?
But Power BI is a means to an end. It is not the solution itself, it is a blank canvas, and it needs to be wielded appropriately to deliver value in your business to support the decision-making you are pursuing on a daily, weekly, and monthly basis. Microsoft has done a great job in making it sound like it’s easy for anyone to use. This means that there are a hundred ways to build the same Power BI data model and report in answer to the requirement of a ‘sales analysis’. We know that ninety of those are the wrong way, which source from the wrong tables, or perform very poorly, or whose visualisations are designed poorly for end-user consumption, or the data models themselves are designed so poorly so as not to be reusable. And your users still want it in Excel too…we understand all this, and this is why we do what we do so well.
Our customers understand this too. You use Power BI extensively in your businesses and you know the challenges are mostly about getting people to change their behaviour, rather than the technology itself. But your needs have quickly become more sophisticated. This isn’t just about levelling up your Excel reports into Power BI versions; you’ve done that (or not yet!). Teams are still siloed, you still don’t have one source of truth, and Power BI Pro doesn’t handle the data volume you need to capture. You have ten/twenty/fifty data sources, with data spanning decades. You need something bigger, but Power BI Premium is too expensive, and its feature-set doesn’t feel like it will solve your problems.
Maturing - Azure
This is where the ‘data warehouse’ topic comes up. You wish that Power BI was a viable solution for this requirement, to centrally govern the source of truth for all your onward analytical requirements. Instead, you must build this some other way.
We very often recommend the use of Jet Analytics as an accelerative solution for our customers, to deploy an ‘out-of-box’ data warehouse and set of six data models, using Azure (or on-premises servers) as the infrastructure for the database and cubes. This makes sense where NAV or Business Central is at the core of your data and reporting needs and provides software which end-users can use to manage the orchestration and transformation of data without needing deep-level SQL skills.
You might also have looked at the native tools in Azure to do the same job. The use of Azure Synapse Analytics to create pipelines, sourcing data from any data source, amalgamating and combining into a structured data warehouse which can then be used as a data source in Power BI.
This sentence sounds simple, but it comes with all sorts of terms. Resource Groups, Resources, Key Vaults, Data Lake, Synapse workspaces, Serverless SQL Pools, Spark Pools…absolutely equipped for enterprise scale data architectures which we deploy for customers in private and public sector alike, and we do it very well. But where do you start to understand the consumption cost of all of this? You need to get your calculator out, estimate the data throughput, the growth rate, the sizes. What is the monthly cost likely to be from thirty to forty resource SKUs in Azure? This makes it feel too hard for many customers. What’s the answer?
Revelation - Microsoft Fabric
Finally, the answer!
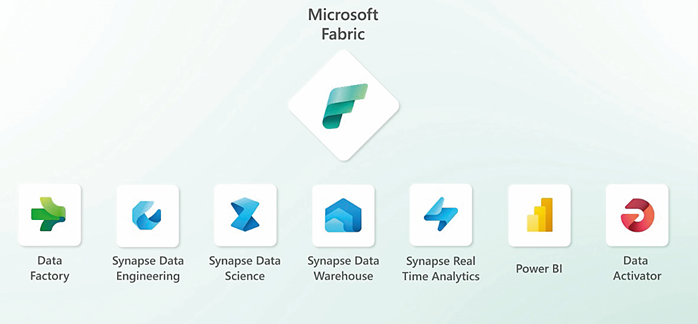
Everything that Power BI is remains, and everything that we wished it to be, has exploded into existence. One neatly wrapped up SaaS solution, which lives in the same Power BI workspace experience that we know and love, now called Fabric workspaces.
We now have access to the ability to create resources much more sophisticated than Power BI datasets (semantic models) and reports alone. We can create data warehouses (and lakehouses) with the click of a button and start to populate them using data factory pipelines, dataflows, or Python notebooks, to extract from a myriad of data sources and construct the database we need at any scale, with Power BI living on top of that.
The capabilities extend to real-time analytics of streaming data, from IoT sensors and data feeds, and the ability to train, test and deploy machine learning models using all this data, and the native ability to manage deployment pipelines for Dev, UAT and Production environments. Not to mention more advanced developer experiences with Git integration, allowing true collaboration, continuous integration and development management. All within the same native Fabric workspace portal (today, a Power BI workspace portal), making it instantly familiar to Power BI developers, and all these features being pre-existing technologies in Azure which have been wrapped up for us.
So far, so exciting. But, the most exciting part, I’m a little ashamed to write, is the licensing model. Every single one of these new ‘workloads’ is available for use in one, single capacity licence cost.
At the time of writing (June 2024), the entry-level F2 SKU is advertised at a cost of £241 per month on a pay-as-you-go-basis, or merely £143 per month if you take an annual contract. For this price, you have access to all the above to build your solution without the need to pre-allocate the capacity. It is only a question of whether you need a Ferrari engine, or 250cc, and there are eleven SKUs to scale to with no commitment beyond hourly pay as you go (under the PAYG option), and transparent monitoring tools.
For example, the F8 SKU costs £965 per month (£573 per month under annual contract). It is just a case of load-testing the solution to identify the appropriate level to handle all your ETL pipeline load times within your acceptable window and deliver the performance that end users need in the Power BI datasets and reports. We have found that the F8 SKU is a good benchmark to expect for handling typical production workloads that we see across the spectrum of our customers in retail, manufacturing and consulting businesses alike, while of course this is dependent on scale and every set of requirements needs to be appraised on their own merits.
The storage layer for any data you need to store for any of these resources is OneLake, which costs £0.02 per GB per month. Nothing! And one of the most ground-breaking and exciting possibilities that this has brought is the ability to bring data into Power BI by ‘Direct Lake mode’. In a nutshell, this means there will no longer be any need to compromise between report and dataset performance, and the need for reporting data to be up to date in real-time. Both will just be the case for analysing very large data volumes in Power BI from OneLake.
You still need Power BI Pro licences for users who wish to consume the reports you publish; these are priced at £8.20 per user per month. You don’t even need this if you have at least an F64 Fabric capacity licence (priced at merely £7,716 per month!).
And that’s it. Those are the licensing costs you need to be aware of for making use of Fabric, which was announced as generally available (production-ready) on 15 November 2023. We have deployed and are continually implementing the platform for multiple customers in multiple industries in the time since using our tried and tested delivery methodology and reference data platform architecture, applied to our shiny new toolkit in Fabric.
Finally, it is worth noting very keenly that if you do opt for F64 or above, this includes Copilot in Fabric, Microsoft’s generative-AI-based personal assistant. This provides users with the ability to generate a narrative summary of an existing Power BI report (what key results are shown in this week’s trading report?), or to place such a narrative summary visual on the report itself; to converse with Copilot with Q&A about data in a dataset, or indeed to generate a new Power BI report entirely based on prompts provided to Copilot.
There is so much more to talk about, more deeply and technically, but for now we all just need to recognise that truly we have one platform which satisfies the analytics needs of the smallest businesses and the largest, enterprise-scale businesses equally. The same platform allows us to build tactical Power BI reports from one or two data sources for only the existing Power BI Pro licensing today, and to scale it whenever we need to, for data warehousing and advanced analytical needs tomorrow.
For reporting and analytics, from smallest to largest, from simplest to most complex, Fabric will be the solution. Talk to us to see it in action.


